
Today, I was wondering exactly what state is best to live off grid. So, went out and did a bunch of research on 12 key factors that make a state great for off grid living. You may be surprised which states came out on top.
What are the best states to live off grid? These 10 states came out the best on a comprehensive 12 factor survey of off grid states:
- Alabama (9.8)
- Missouri (9.5)
- Georgia (9.2)
- Tennessee (9.2)
- Texas (9.0)
- Louisiana (8.8)
- Indiana (8.7)
- Hawaii (8.5)
- Colorado (8.4)
- Arkansas (8.4)
You may wonder how I came to this list. And, what makes these states perfect for off grid living. Below I detail exactly how I made this list, and all the details of my research on all 50 states, so you can see why your state of choice did or didn’t make the list!
How I Found the Best States for Off Grid Living
In order to get a well rounded idea of how well each state might fit an off grid lifestyle, I considered 6 main categories of factors. Cost of living, freedom of lifestyle, water availability, how easy it is to grow food there, energy availability, and the community in that area. Each of these areas pulled in data from multiple sources, which I used to rank each state on a scale of 10 in each of those categories. Then I combined the categories by how important I think each one is, in order to come up with the overall score for each state.
10 Best States to Live Off Grid
| State | Overall | Cost | Freedom | Water | Agriculture | Energy | Community |
|---|---|---|---|---|---|---|---|
| Alabama | 9.8 | 9.1 | 10 | 9.4 | 7.2 | 4.2 | 1.1 |
| Missouri | 9.5 | 7.9 | 10 | 7.3 | 7.2 | 4.1 | 6.6 |
| Georgia | 9.2 | 8.0 | 10 | 7.1 | 7.1 | 4.4 | 1.1 |
| Tennessee | 9.2 | 8.2 | 10 | 8.6 | 5.9 | 4.0 | 1.4 |
| Texas | 9.0 | 6.4 | 9.25 | 5.8 | 7.3 | 7.7 | 1.7 |
| Louisiana | 8.8 | 9.2 | 3 | 9.3 | 8.1 | 5.3 | 1.0 |
| Indiana | 8.7 | 7.3 | 10 | 7.3 | 4.1 | 5.9 | 1.4 |
| Hawaii | 8.5 | 4.7 | 3 | 10.0 | 9.9 | 8.0 | 1.8 |
| Colorado | 8.4 | 8.3 | 8.5 | 4.4 | 2.5 | 8.8 | 2.5 |
| Arkansas | 8.4 | 8.8 | 3 | 8.2 | 5.9 | 7.3 | 1.1 |
States with the Lowest Property Taxes and Cost of Living
In my opinion, the overall cost of living is one of the most important factors when choosing a place to live off grid. Many people interested in the off grid lifestyle are hoping to save money
For this area, I considered the cost of land in that area, property taxes, and the cost of living index. I then rated each state from best to worst in each of these statistics, and combined their rank to get the overall cost of living score for that state.
| State | Cost Score | Cost of Land | Property Taxes | Cost of Living Index |
|---|---|---|---|---|
| New Mexico | 9.2 | 521 | 0.55% | 87.5 |
| Louisiana | 9.2 | 3,045 | 0.18% | 93.9 |
| Alabama | 9.1 | 2,984 | 0.33% | 89.3 |
| Mississippi | 8.9 | 2,745 | 0.52% | 86.1 |
| Wyoming | 8.8 | 779 | 0.58% | 97.3 |
| Arkansas | 8.8 | 3,163 | 0.52% | 86.9 |
| Oklahoma | 8.6 | 1,734 | 0.74% | 87.0 |
| Arizona | 8.5 | 811 | 0.72% | 97.0 |
| Utah | 8.5 | 1,817 | 0.60% | 98.4 |
| South Carolina | 8.4 | 3,573 | 0.50% | 95.9 |
To get a rough figure for the cost of land in each state, I looked at USDA data on crop land valuation. The number shown in the table is the average cost per acre of farmland. While this number will probably be a bit higher than you might actually spend for a good piece of off grid land, the relative cost is about right. The number was only used to get a relative sense of land prices in each state.
Even for an off gridder, property taxes are a given, so I thought I should defiantly include this in the score. I didn’t include state income or sale tax, because I thought those are less important for a partially or wholly self-sufficient person. And, part of that is included in the cost of living index.
Lastly, I included a cost of living index, which gives a relative idea of how expensive it is to shop and live in the area, covering things like gas and groceries. For many people getting started off grid, you will still be buying quite a bit. I thought I should include this to account for states like Alaska that have low land costs, but cost of living there and getting material makes up tho bulk of the cost of setting up an household in that area.
References
- Land Cost: ftp://ftp.nass.usda.gov/quickstats/
- Property Tax Rate: http://worldpopulationreview.com/states/property-taxes-by-state/
- Cost of Living Index: http://worldpopulationreview.com/states/cost-of-living-index-by-state/
States with the Most Freedom for Off Grid Living
The next thing I looked at in my search for the best state to live off grid was the regulations and “freedom” of that particular area. Laws are very different from state to state, so I choose laws that are relatively easy to compare and have big bearing on off grid life — building codes and water rights.
| State | Freedom Score | Counties w/o Building Codes | Water Right |
|---|---|---|---|
| Alabama | 10 | Many | Riparian |
| Tennessee | 10 | Many | Riparian |
| Georgia | 10 | Truelten County | Riparian |
| Missouri | 10 | Many | Riparian |
| Indiana | 10 | All (Owner Built) | Riparian |
| Maine | 10 | Many | Riparian |
| Texas | 9.25 | Many | Hybrid |
| Wyoming | 8.5 | Many | Prior Appropriaton |
| Colorado | 8.5 | Delta County, Custer County, Montezuma County | Prior Appropriaton |
| Idaho | 8.5 | Idaho County, Bonner County, Boundary County | Prior Appropriaton |
| Montana | 8.5 | Many | Prior Appropriaton |
| Nevada | 8.5 | Eureka County | Prior Appropriaton |
| Alaska | 8.5 | Many | Prior Appropriaton |
Off Grid and Building Codes
Many off gridders are interested in building home themselves. Tiny homes, natural building, off grid cabins, container homes, and the like generally run afoul of bailing codes. Which is why off gridders prefer to live in counties and states with minimal building codes or other regulations.
While pretty much every state has some form of regulation regarding septic, electrical, and plumbing there are still some that don’t really mind if you build the way that you want.
In the score above, lack of building regulations made up he bulk of the score. Much of this information comes talking to people who live in those areas, as building codes are hard to research. Links to some states’ info below as well.
Water Rights
I also included a bit of adjustment based on the state’s water rights situations. East coast states tend to have the most liberal policy, riparian, where if you have access to water, then you can use it within reason.
West of the Mississippi, most states have some form of “prior appropriation” which means you need to apply for a permit in order to use water, and the oldest permits get preference. This is not so good because while you may have a stream on you property, it doesn’t mean you will have the right to use the water in any way.
Some states also have mixed policies, which is a little of both. You get some rights just by owning the property and others you must apply for. I gave mixed states a middle score.
References
- Water Rights: https://extension.okstate.edu/fact-sheets/whose-water-is-it-anyway.html
- MO Building Codes by County: https://data.mo.gov/Economic-Development/County-Building-Codes-for-Missouri/iq7s-izvt
- TN Counties that require permit: https://www.tn.gov/content/tn/commerce/fire/residential-permits/fire-apply-for-a-residential-permit.html
- IN Log Cabin Rule IC 36-7-8-3(d): http://iga.in.gov/legislative/laws/2019/ic/titles/036#36-7-8-1
States with the Best Off Grid Water Access
The next component I looked at when choosing the best state was water accessibility. Dry desert land requires deeper, more expensive wells which offsets the low cost of such property.
I also included a factor that considers the current legislating for rain water collection. Rain water collection can be a cheap and independent way to gather water for your home and garden. But, some states allow it while others don’t.
| State | Water Score | Rain Water Harvesting | Annual Rain Fall (inches) |
|---|---|---|---|
| Hawaii | 10.0 | Unrestricted | 63.7 |
| Alabama | 9.4 | Unrestricted | 58.3 |
| Louisiana | 9.3 | Legal | 60.1 |
| Mississippi | 9.2 | Legal | 59.0 |
| Florida | 9.0 | Unrestricted | 54.5 |
| Tennessee | 8.6 | Legal | 54.2 |
| Connecticut | 8.5 | Unrestricted | 50.3 |
| Kentucky | 8.4 | Unrestricted | 48.9 |
| Arkansas | 8.2 | Legal | 50.6 |
| North Carolina | 8.2 | Legal | 50.3 |
To create the water accessibility score for my off grid ranking system, I weighted the rainfall at 70% added a 30% component of rain water collection laws, given that a permissive state for rain water collection can offset water issues caused by lack of rainfall.
Be aware, however, that this evaluation is one of the many that highlight the weakness of state by state analysis. For instance Washington or Oregon might have been on this list if only considering the wet strip west of the cascade mountains. Yet, their eastern most portions are quite dry. Which, in the end, makes them overall an average choice on paper, but depending in where you live in the state you will either one of the wettest or one of the driest homesteading experiences on the list.
References
- Rain Water Harvesting: https://worldwaterreserve.com/rainwater-harvesting/is-it-illegal-to-collect-rainwater/
- Rainfall data: https://www.currentresults.com/Weather/US/average-annual-state-precipitation.php
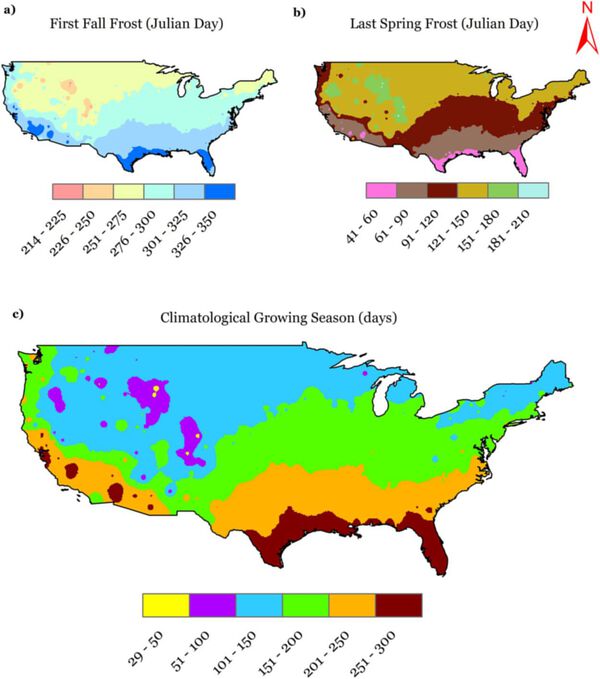
Best States for Growing a Off Grid Garden
In order to figure out the best state for a self-sufficient off grid homestead, I also attempted to include the state’s overall agricultural productivity. You will have a much easier time growing a family’s food in Texas than you would in Alaska.
Warm, relatively southern states are the winners in the agricultural productivity arena, as you might expect. Florida and Hawaii are nearly tied, with Louisiana below that and Texas still quite productive.
One of the most commonly used ways to measure agricultural productivity by experts is “Growing Degree Days” (GDD). With GDD, the bigger the number, the more opportunity you have in a year to grow large harvests. Bigger GDD, usually the more food per acre.
| State | Agriculture Score | Climate (GDD) |
|---|---|---|
| Florida | 10.0 | 8397 |
| Hawaii | 9.9 | 8322 |
| Louisiana | 8.1 | 7038 |
| Texas | 7.3 | 6522 |
| Alabama | 7.2 | 6424 |
| Missouri | 7.2 | 6421 |
| Georgia | 7.1 | 6385 |
| South Carolina | 7.0 | 6321 |
| Arizona | 6.2 | 5748 |
Climate data from NOAA sensor data from 2019. I averaged temperature data and calculated the GDD using daily minimum and maximum temperature formulation in day increments, and the yearly total is shown above.
References
- Climate data: https://www1.ncdc.noaa.gov/pub/data/ghcn/daily/by_year/2019.csv.gz(large .gz file)
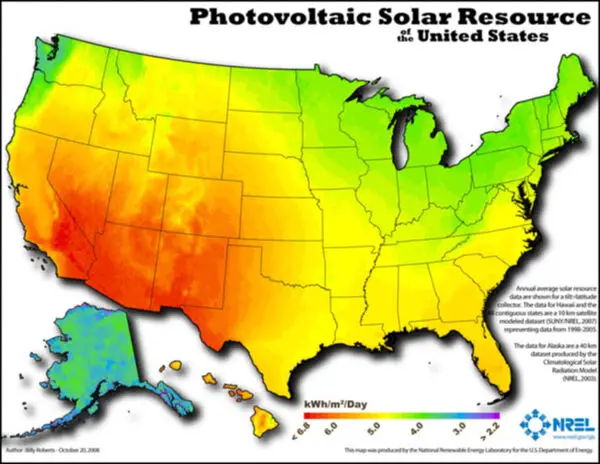
Off Grid Power Potential by State
Here is the 10 states with the most potential for off grid solar or wind power:
| State | Power Score | Solar Availability | Wind Availability |
|---|---|---|---|
| Colorado | 8.8 | 1.0 | 7.0 |
| Kansas | 8.6 | 1.0 | 7.0 |
| Nebraska | 8.2 | 0.9 | 7.0 |
| South Dakota | 8.1 | 0.9 | 7.0 |
| Hawaii | 8.0 | 1.2 | 5.0 |
| North Dakota | 7.9 | 0.8 | 7.0 |
| New Mexico | 6.8 | 1.2 | 5.0 |
| Oklahoma | 7.7 | 1.0 | 6.0 |
| Texas | 7.7 | 1.0 | 6.0 |
| Wyoming | 7.6 | 1.0 | 6.0 |
Windy states like Colorado, Kansas, and Nebraska that have relatively sunny summers and winters are the clear winners on the ranking of off grid energy potential.
To generate these figures, I looked at the average yearly amount of sun and wind available in each state.
Solar availability is a relative value that indicates the average number of hours of peak sun light would be available in the state. This number considers differences in daylight due to latitude, as well as variations in cloud cover from state to state.
The wind availability is the average wind speed at 30 meters height above ground. This number is fairly representative of relative amount of wind power you might expect in that state, although wind power varies substantially from place to place due to local topography, foliage, and other small scale obstructions.
To generate the power score, I ranked the states in both solar and wind availability, then averaged their score.
References
- Solar potential by state: https://neo.ne.gov/programs/stats/inf/201.htm
- Windspeed data by state: https://windexchange.energy.gov/maps-data/325
States with the Largest Number of People Living Off Grid
When ranking off grid states, I lastly considered community. The more people living and off grid lifestyle, the more likely the community is to be receptive and the laws accommodating to alternative living. You may also want to go off grid with a group, or find a community out in the woods that share your interests. Off grid doesn’t necessarily mean all alone.
This list bring out a few states that aren’t found elsewhere on the rankings. Western states like California and Oregon have a vibrant off grid community. There are also some states that rank high for other aspects of off grid living, such as Missouri and Colorado, that are already popular with the off grid crowd.
| State | Community Score | Well Known Communities | IC Listings | Off Grid Score |
|---|---|---|---|---|
| California | 10.0 | Emerald Earth | 57 | 7.2 |
| Oregon | 7.9 | Three Rivers Recreation Area, Breitenbush | 27 | 6.3 |
| North Carolina | 7.6 | Earthaven | 23 | 7.5 |
| Virginia | 7.1 | Twin Oaks Community | 16 | 7.1 |
| New Mexico | 6.9 | Greater World Community | 13 | 7.7 |
| Missouri | 6.6 | Dancing Rabbit Ecovillage | 9 | 9.5 |
| Washington | 3.4 | 34 | 6.7 | |
| New Hampshire | 2.8 | 26 | 6.4 | |
| Colorado | 2.5 | 22 | 8.4 | |
| New York | 2.4 | 20 | 6.7 |
This ranking is probably the hardest to get right, because so many off grid people rather not advertise themselves. So, popular homesteading destinations such as Idaho and Arkansas don’t appear, because I could find good data on how many off gridders ar there. But that doesn’t mean you won’t find a community in these locations, it just take a little more looking.
To generate these numbers, I looked at the number of well know off grid communities in the state, as well as the total number of “intentional” off grid communities classifieds are posted for that state. My thinking being that classified listings show an interested from offgridders and that established communities are likely to attract beginners to the area.
References
Off Grid Living Score for All 50 States
Below is the ranking of all 50 states for homesteading from best to worst. This list considers cost of living, freedom / government intervention, water access, agricultural productivity, off grid energy potential, and what kind of an off grid community is in place.
| State | Overall | Cost | Freedom | Water | Agriculture | Energy | Community |
|---|---|---|---|---|---|---|---|
| Alabama | 9.8 | 9.1 | 10 | 9.4 | 7.2 | 4.2 | 1.1 |
| Missouri | 9.5 | 7.9 | 10 | 7.3 | 7.2 | 4.1 | 6.6 |
| Georgia | 9.2 | 8.0 | 10 | 7.1 | 7.1 | 4.4 | 1.1 |
| Tennessee | 9.2 | 8.2 | 10 | 8.6 | 5.9 | 4.0 | 1.4 |
| Texas | 9.0 | 6.4 | 9.25 | 5.8 | 7.3 | 7.7 | 1.7 |
| Louisiana | 8.8 | 9.2 | 3 | 9.3 | 8.1 | 5.3 | 1.0 |
| Indiana | 8.7 | 7.3 | 10 | 7.3 | 4.1 | 5.9 | 1.4 |
| Hawaii | 8.5 | 4.7 | 3 | 10.0 | 9.9 | 8.0 | 1.8 |
| Colorado | 8.4 | 8.3 | 8.5 | 4.4 | 2.5 | 8.8 | 2.5 |
| Arkansas | 8.4 | 8.8 | 3 | 8.2 | 5.9 | 7.3 | 1.1 |
| Maine | 8.3 | 6.8 | 10 | 7.6 | 3.3 | 4.9 | 1.4 |
| Florida | 8.2 | 7.0 | 0.75 | 9.0 | 10.0 | 5.6 | 1.6 |
| Idaho | 8.1 | 8.3 | 8.5 | 5.0 | 3.4 | 5.5 | 1.1 |
| Wyoming | 8.1 | 8.8 | 8.5 | 4.1 | 1.9 | 7.6 | 1.1 |
| South Carolina | 8.1 | 8.4 | 3 | 8.2 | 7.0 | 4.4 | 1.1 |
| Oklahoma | 8.0 | 8.6 | 2.25 | 6.7 | 5.9 | 7.7 | 1.2 |
| Mississippi | 7.9 | 8.9 | 3 | 9.2 | 4.8 | 4.4 | 1.1 |
| Montana | 7.9 | 8.0 | 8.5 | 4.3 | 2.0 | 7.1 | 1.0 |
| New Mexico | 7.7 | 9.2 | 1.5 | 4.3 | 4.5 | 7.8 | 6.9 |
| Kentucky | 7.6 | 8.1 | 3 | 8.4 | 5.4 | 3.9 | 1.1 |
| North Carolina | 7.5 | 7.7 | 3 | 8.2 | 3.4 | 4.3 | 7.6 |
| Kansas | 7.4 | 7.5 | 2.25 | 5.8 | 4.5 | 8.6 | 1.1 |
| Delaware | 7.4 | 7.2 | 3 | 8.0 | 5.6 | 3.9 | 1.0 |
| Nevada | 7.3 | 7.9 | 8.5 | 1.0 | 2.1 | 6.9 | 1.1 |
| Nebraska | 7.3 | 6.3 | 2.25 | 5.3 | 6.2 | 8.2 | 1.0 |
| Iowa | 7.2 | 6.3 | 3 | 6.7 | 4.3 | 7.1 | 1.5 |
| Arizona | 7.2 | 8.5 | 1.5 | 2.4 | 6.2 | 6.9 | 2.0 |
| California | 7.2 | 5.0 | 2.25 | 5.1 | 5.8 | 6.9 | 10.0 |
| Virginia | 7.1 | 7.6 | 3 | 7.6 | 2.3 | 4.1 | 7.1 |
| Maryland | 7.0 | 5.8 | 3 | 7.6 | 5.0 | 4.9 | 1.4 |
| Ohio | 7.0 | 6.4 | 3 | 7.0 | 4.2 | 5.4 | 1.4 |
| Wisconsin | 6.8 | 5.8 | 3 | 6.3 | 4.5 | 5.8 | 1.6 |
| Vermont | 6.8 | 5.7 | 3 | 7.4 | 5.3 | 3.5 | 2.0 |
| Alaska | 6.8 | 5.6 | 8.5 | 5.4 | 1.0 | 4.0 | 1.2 |
| South Dakota | 6.7 | 7.1 | 2.25 | 4.9 | 2.6 | 8.1 | 1.0 |
| North Dakota | 6.7 | 6.9 | 2.25 | 4.6 | 2.9 | 7.9 | 1.0 |
| New York | 6.7 | 5.7 | 3 | 7.3 | 4.4 | 3.9 | 2.4 |
| Washington | 6.7 | 7.3 | 2.25 | 6.9 | 3.0 | 4.0 | 3.4 |
| Minnesota | 6.6 | 6.9 | 3 | 5.7 | 2.3 | 5.9 | 1.6 |
| Pennsylvania | 6.6 | 6.0 | 3 | 7.4 | 3.7 | 3.9 | 1.5 |
| West Virginia | 6.6 | 6.7 | 3 | 7.7 | 2.6 | 3.7 | 1.4 |
| Michigan | 6.5 | 6.2 | 3 | 6.3 | 2.5 | 5.5 | 1.6 |
| New Hampshire | 6.4 | 5.0 | 3 | 7.5 | 3.4 | 3.9 | 2.8 |
| Oregon | 6.3 | 6.8 | 2.25 | 3.0 | 3.3 | 4.2 | 7.9 |
| Massachusetts | 6.2 | 4.7 | 3 | 7.9 | 2.2 | 4.9 | 1.9 |
| Illinois | 6.2 | 5.3 | 3 | 5.8 | 2.3 | 5.7 | 1.2 |
| Utah | 6.1 | 8.5 | 1.5 | 1.3 | 3.0 | 5.6 | 1.5 |
| Connecticut | 6.0 | 3.4 | 3 | 8.5 | 3.5 | 3.7 | 1.2 |
| Rhode Island | 6.0 | 3.3 | 3 | 8.0 | 3.7 | 3.8 | 1.1 |
| New Jersey | 5.6 | 2.7 | 3 | 7.9 | 2.5 | 3.8 | 1.1 |
Related Questions
Is it legal to live off grid in Utah?
Yes. Many areas of Utah allow off grid living. And, with low property values, lower cost of living, and good solar access it is a relatively good choice. Although, not one of the top 10 choices.
What states is it illegal to live off the grid?
There are no states the specifically outlaw off grid living. However you will have to content with water rights and building permits to live off grid legally. The freeist states for off grid living are — Alabama, Tennessee, Georgia, Missouri, Indiana, Maine, and Texas.